
Coin Flip Outcomes Table: 2, 3 & 4 Flips Explained
 Updated November 11, 2026
11 min read
In this article
- Quick Answer: The Coin Flip Outcomes Table in Short
- What Is a Coin Flip Outcomes Table?
- How Do You Build a Coin Flip Outcomes Table?
- Coin Flip Outcomes Table for 2 Flips
- Coin Flip Outcomes Table for 3 Flips
- Coin Flip Outcomes Table for 4 Flips
- Coin Flip Outcomes Table: Probability Summary
- Coin Flip Outcomes Table Example: At Least 2 Heads in 3 Flips
- Coin Flip Outcomes Table for Beginners: Common Mistakes
- Coin Flip Outcomes Table Worksheet and PDF
- Coin Flip Outcomes Table Generator and Calculator
- Theoretical vs Experimental Results: Why 10 Flips Rarely Look 50/50
Coin Flip Outcomes Table: 2, 3 & 4 Flips Explained
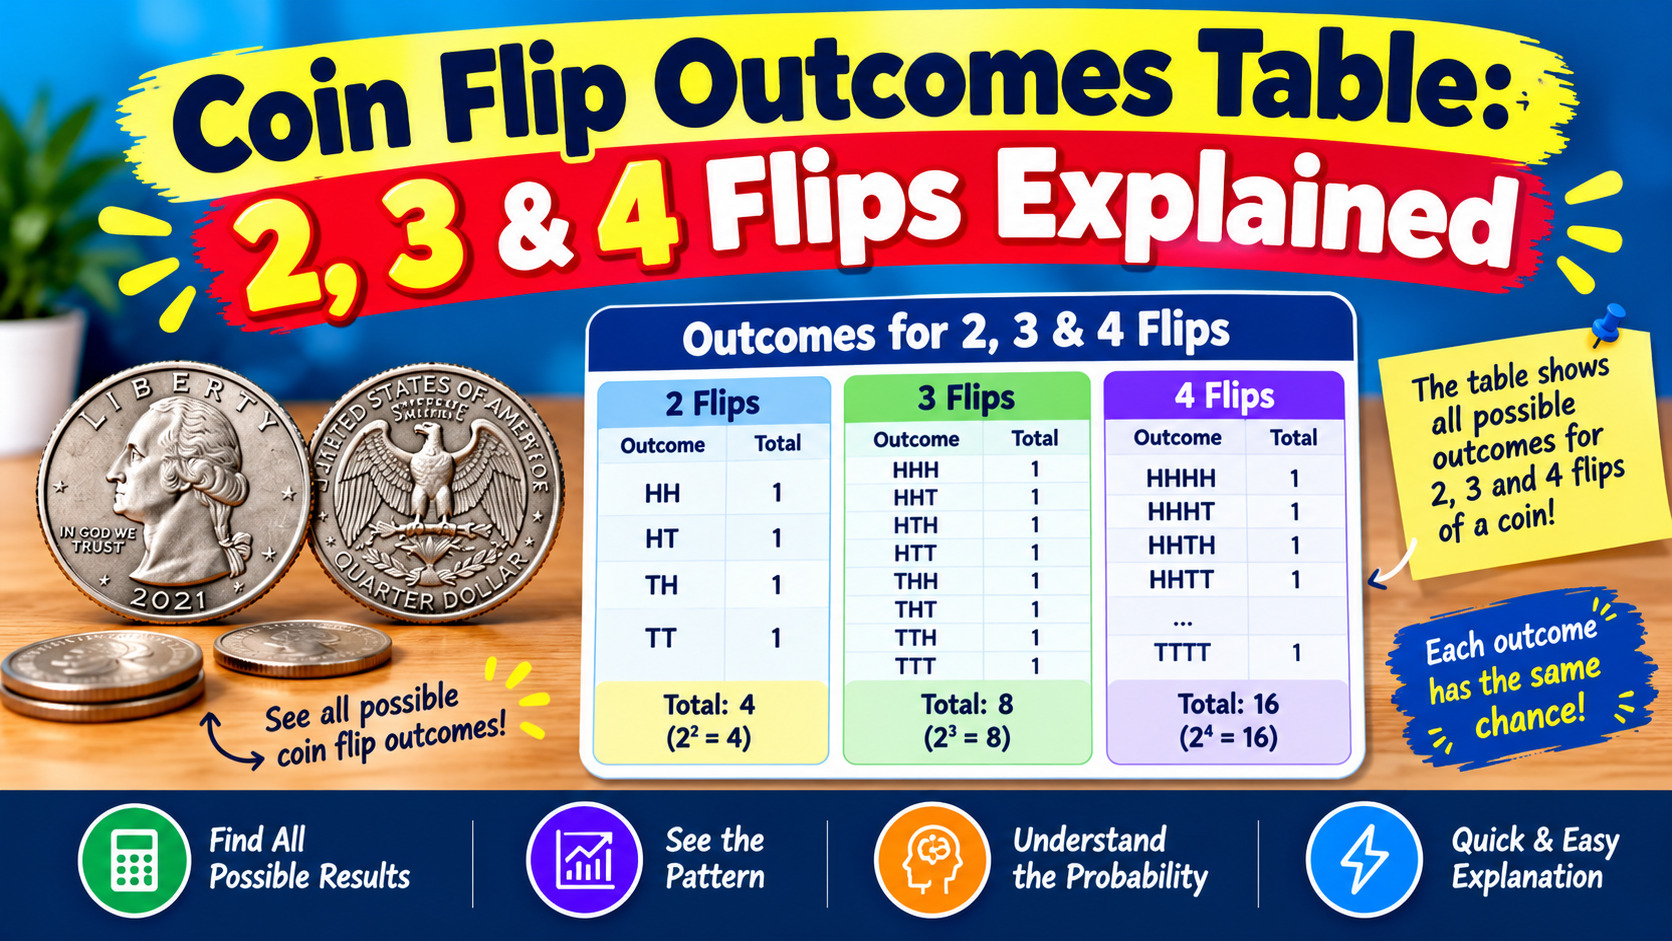
A coin flip outcomes table lists every possible result when you flip a coin a set number of times. Two flips give 4 outcomes, three give 8 and four give 16, following the 2ⁿ rule. On a fair coin, every row in the table is equally likely.
That’s the short version. The rest of this page shows the actual tables, how to build your own, and how to use them to work out probabilities. You can also flip a coin online as you read and compare your results with the tables.
Quick Answer: The Coin Flip Outcomes Table in Short
- 1 flip = 2 outcomes, 2 flips = 4, 3 flips = 8, 4 flips = 16
- The formula is 2ⁿ, where n is the number of flips
- Every row is equally likely if the coin is fair
- To find a probability, count the rows you want and divide by the total rows
I remember the first time I put one of these on a whiteboard for a group of students. Half the room insisted that getting heads, then tails (HT) was “more random” than getting two heads in a row. The table settled it in about ten seconds. HH and HT are both single rows out of four. Same chance.
What Is a Coin Flip Outcomes Table?
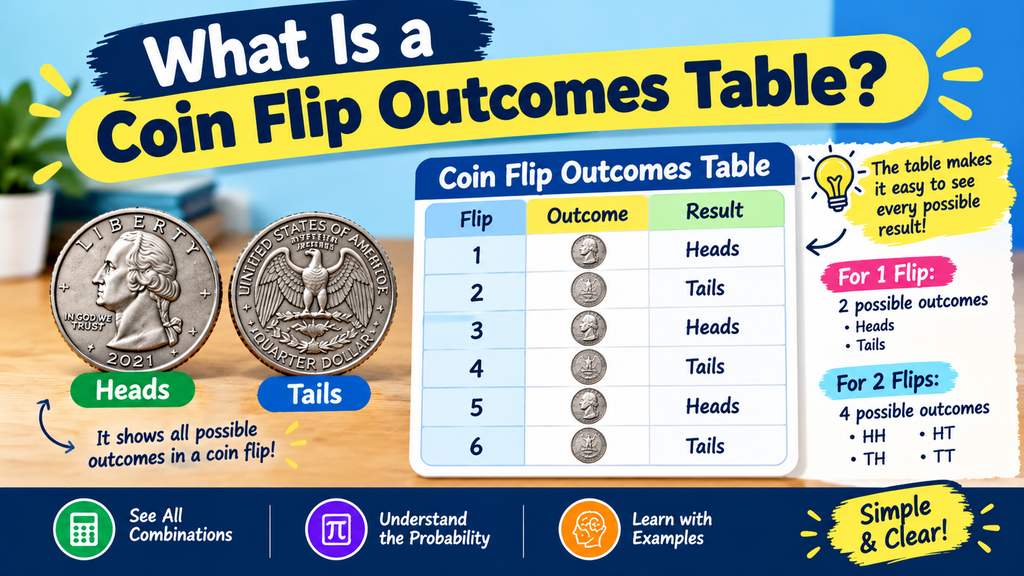
A coin flip outcomes table is a list of every sequence you could get from a fixed number of flips, written with H for heads and T for tails. Mathematicians call that complete list the sample space.
The table matters because it turns a vague question (“what are my chances?”) into a counting job. You don’t need clever formulas. You list the outcomes, circle the ones you care about, and divide.
Everything on this page assumes a fair coin, meaning heads and tails each have a 50% chance, and each flip is an independent event. The coin has no memory. If you’d like to see this in action, a virtual coin flip behaves the same way.
How Do You Build a Coin Flip Outcomes Table?
Start with one flip, then add a flip at a time, doubling the list each round. It takes about two minutes once you’ve done it once.
- Write the single-flip outcomes: H and T.
- Add a second flip. Copy each outcome twice and attach H to one copy and T to the other. You now have HH, HT, TH, TT.
- Repeat for each extra flip. Every existing row splits into two new rows.
- Check the count. The total should equal 2ⁿ. If it doesn’t, you’ve missed a row or doubled one.
- Add a column for the number of heads. This makes probability questions much faster.
A tree diagram does the same job visually. Each flip is a fork, and each path from left to right is one row of the table. If you’d rather watch it happen, try a coin flipper and write down the sequences as they come.
Coin Flip Outcomes Table for 2 Flips
The coin flip outcomes table for two flips has 4 equally likely rows. Each has a probability of 1/4.
| Outcome | Flip 1 | Flip 2 | Number of heads |
| 1 | H | H | 2 |
| 2 | H | T | 1 |
| 3 | T | H | 1 |
| 4 | T | T | 0 |
Look at the “number of heads” column. Getting exactly one head shows up twice (HT and TH), so P(1 head) = 2/4 = 1/2. Two heads and zero heads show up once each, so each is 1/4.
A lot of beginners miss that HT and TH are different outcomes. Order matters in the table, even if it doesn’t matter to the result you’re counting. You can try a 2-coin flip yourself and watch both orders appear, or read our guide to the outcomes in 2 coin flips.
Coin Flip Outcomes Table for 3 Flips
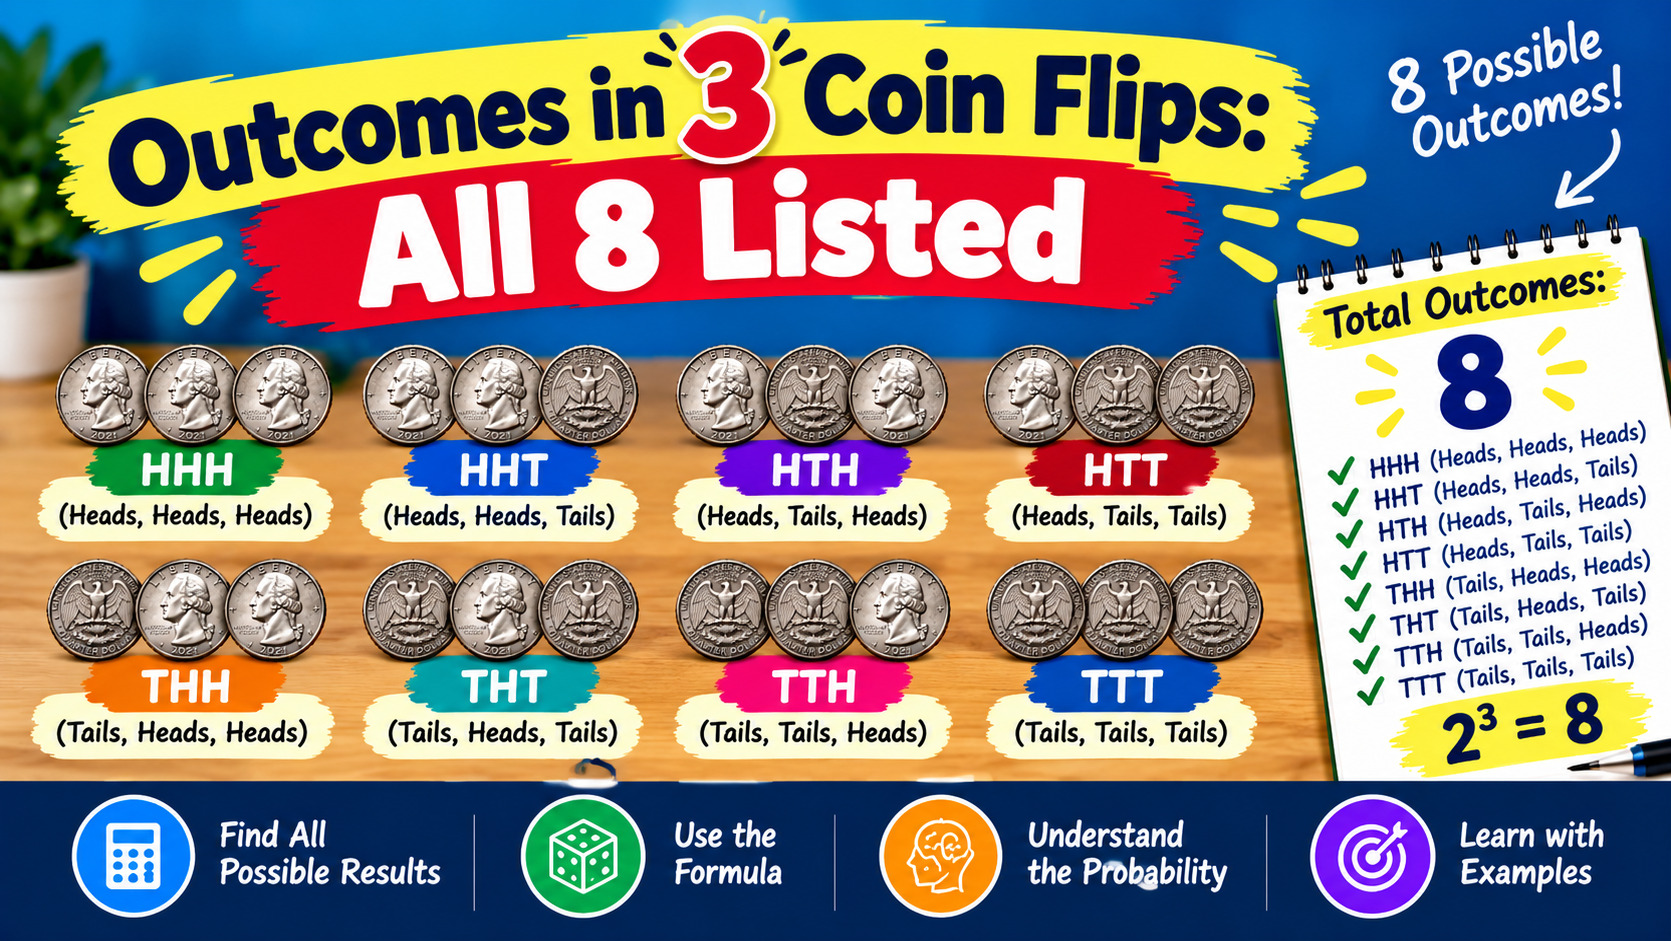
The coin flip outcomes table for three flips has 8 rows, each with a probability of 1/8.
| Outcome | Sequence | Number of heads |
| 1 | HHH | 3 |
| 2 | HHT | 2 |
| 3 | HTH | 2 |
| 4 | HTT | 1 |
| 5 | THH | 2 |
| 6 | THT | 1 |
| 7 | TTH | 1 |
| 8 | TTT | 0 |
Group them by heads and a pattern appears: 1 outcome with zero heads, 3 with one head, 3 with two heads, and 1 with three heads. So the probabilities are 1/8, 3/8, 3/8 and 1/8.
That 1-3-3-1 pattern isn’t a coincidence. It’s a row of Pascal’s triangle, which we’ll get to shortly. If you want to see how often each group turns up in practice, simulate multiple coin flips and tally the heads. For a fuller walkthrough of this table, see the outcomes in 3 coin flips.
Coin Flip Outcomes Table for 4 Flips
The coin flip outcomes table for four flips has 16 rows, each with a probability of 1/16.
| Heads | Outcomes | Count |
| 0 | TTTT | 1 |
| 1 | HTTT, THTT, TTHT, TTTH | 4 |
| 2 | HHTT, HTHT, HTTH, THHT, THTH, TTHH | 6 |
| 3 | HHHT, HHTH, HTHH, THHH | 4 |
| 4 | HHHH | 1 |
I grouped these by heads count so the table stays readable. Written one per line it would be 16 rows, and the grouped version shows the same information with less scrolling.
The middle group is the biggest. Exactly two heads has 6 of the 16 outcomes, so it’s the single most likely result at 6/16, or 37.5%. If you want to test that, flip four coins at once a few dozen times and see how close you get.
Coin Flip Outcomes Table: Probability Summary
This coin flip outcomes table compares 2, 3 and 4 flips side by side. The “ways” column tells you how many rows in the full table produce that number of heads.
| Heads | 2 flips (ways / probability) | 3 flips (ways / probability) | 4 flips (ways / probability) |
| 0 | 1 / 1/4 | 1 / 1/8 | 1 / 1/16 |
| 1 | 2 / 2/4 | 3 / 3/8 | 4 / 4/16 |
| 2 | 1 / 1/4 | 3 / 3/8 | 6 / 6/16 |
| 3 | n/a | 1 / 1/8 | 4 / 4/16 |
| 4 | n/a | n/a | 1 / 1/16 |
| Total rows | 4 | 8 | 16 |
Where does Pascal’s triangle come in?
The “ways” numbers are called combinations, written C(n, k), meaning “n flips, choose which k are heads.” For 4 flips, C(4, 2) = 6, which matches the table above.
Those numbers are exactly the rows of Pascal’s triangle: 1-2-1, then 1-3-3-1, then 1-4-6-4-1. If you want to explore the pattern further, the Math Is Fun page on Pascal’s triangle is a friendly place to start.
For longer runs of flips, the same pattern is described by the binomial distribution. You don’t need it for 2, 3 or 4 flips, but it’s what takes over when listing every row stops being practical.
Coin Flip Outcomes Table Example: At Least 2 Heads in 3 Flips
Question: What’s the probability of getting at least 2 heads in 3 flips?
“At least 2” means 2 heads or 3 heads. Use the 3-flip coin flip outcomes table:
- Exactly 2 heads: HHT, HTH, THH (3 outcomes)
- Exactly 3 heads: HHH (1 outcome)
That’s 4 favourable outcomes out of 8, so the probability is 4/8, or 1/2 (50%).
Notice that I never multiplied any probabilities. I counted rows and divided. That’s the whole advantage of the table. If you’d like to check an answer like this one by hand, flip three coins a bunch of times on a heads or tails page and see if about half the rounds hit two or more heads.
Coin Flip Outcomes Table for Beginners: Common Mistakes
If you’re just starting out, these are the slip-ups I see most often:
- Treating HT and TH as the same. They’re two separate rows. Collapsing them gives you 3 outcomes instead of 4 and wrong probabilities.
- Thinking “mixed” results are rarer than streaks. HHHT is exactly as likely as HHHH. Mixed results just have more combinations that count as “mixed.”
- Believing a streak makes the opposite result “due.” This is the gambler’s fallacy. After five heads, the next flip is still 50/50. The gambler’s fallacy is one of the best-documented mistakes in probability.
- Forgetting the total. If your rows don’t add up to 2ⁿ, something’s missing.
- Mixing up “exactly” and “at least.” “At least 2 heads” includes 3 and 4 heads. “Exactly 2” doesn’t.
Here’s a small analogy. Think of the table as a seating chart for a wedding where every guest is equally welcome. Probability is just asking how many of the seats belong to a particular table.
For a slower, step-by-step walkthrough of probability basics, Khan Academy’s probability lessons are free and well paced.
Coin Flip Outcomes Table Worksheet and PDF
A good worksheet gets students to build the coin flip outcomes table themselves before they see the answer. Filling in blanks teaches less than starting from an empty grid.
If you’re making a printable PDF for a class or for your own practice, include:
- An empty grid with room for 4, 8 and 16 rows
- A “number of heads” column to fill in
- A blank tree diagram
- A short section on predicting before flipping, then comparing with real results
- An answer key on a separate page
Here are five practice questions you can drop straight into a worksheet.
- How many outcomes are there for 5 flips? Answer: 2⁵ = 32 (see the probability of 5 coin flips for the full table)
- In the 3-flip table, what’s P(exactly 1 head)? Answer: 3/8
- In the 4-flip table, what’s P(at least 3 heads)? Answer: 5/16 (4 ways for 3 heads plus 1 way for 4 heads)
- What’s P(HHH) in 3 flips? Answer: 1/8
- What’s P(all tails) in 4 flips? Answer: 1/16
When you’ve finished, test your answers with a coin toss by running each scenario a few dozen times.
Coin Flip Outcomes Table Generator and Calculator
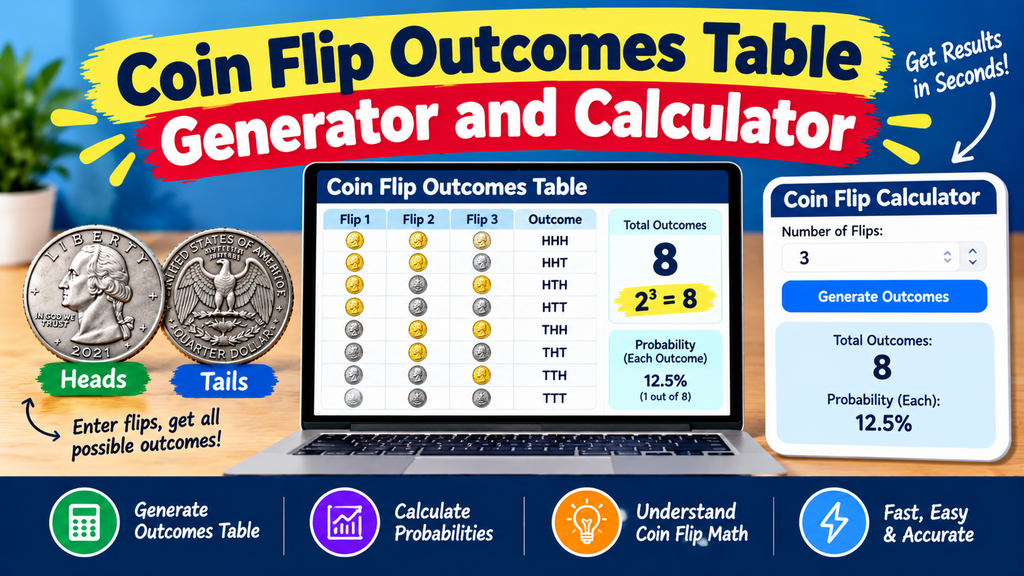
You don’t strictly need either one. The 2ⁿ rule gives you the number of outcomes in your head, and the combination counts from Pascal’s triangle give you the probabilities.
Still, a generator is handy for checking your coin flip outcomes table, and a calculator is handy once the number of flips gets large. Writing out 1,024 rows for 10 flips isn’t a good use of anyone’s afternoon.
A simple check works like this:
- Work out 2ⁿ for your number of flips.
- Count the rows in your table. They should match.
- Pick a target (say, exactly 2 heads) and count matching rows.
- Divide matching rows by total rows.
- Compare against a simulation.
A free coin flip tool is good for the last step. Run it enough times and the results should settle near the table’s probabilities.
Theoretical vs Experimental Results: Why 10 Flips Rarely Look 50/50
Theoretical probability is what the coin flip outcomes table predicts. Experimental probability is what actually happens when you flip. They match over a long run, but not over a short one.
Take 10 flips. The chance of getting exactly 5 heads is 252 out of 1,024, or about 24.6%. So roughly three times out of four, you won’t see a perfect 5-5 split, even with a perfectly fair coin.
With 20 flips, the chance of exactly 10 heads drops to about 17.6%. Longer runs get closer to 50% heads in proportion, but the exact count gets harder to hit.
That’s the gap between what the table says and what a short experiment shows. It’s also why a single odd afternoon of flipping doesn’t prove a coin is biased. If you want to see this yourself, run your own experiment with 10 flips, then 50, then 200, and write down the heads percentage each time.
For a broader introduction to sample spaces and probability, see this overview of the sample space.
How many outcomes are there in 3 coin flips?
There are 8 outcomes in 3 coin flips. The formula is 2ⁿ, so 2 × 2 × 2 = 8. They are HHH, HHT, HTH, HTT, THH, THT, TTH and TTT. On a fair coin, each one has a probability of 1/8, or 12.5%.
How many outcomes are there in 4 coin flips?
There are 16 outcomes in 4 coin flips, because 2⁴ = 16. Of these, 1 has zero heads, 4 have one head, 6 have two heads, 4 have three heads and 1 has four heads. Each individual sequence has a probability of 1/16, or 6.25%.
What is the probability of getting exactly 2 heads in 3 flips?
The probability is 3/8, or 37.5%. Three of the eight outcomes contain exactly two heads: HHT, HTH and THH. You can find this by counting rows in the 3-flip table and dividing by the total of 8.
Is HHHH as likely as HTHT?
Yes. On a fair coin, every specific sequence of four flips has the same 1/16 chance. HHHH only feels less random because streaks stand out to us. The table shows both sequences as single rows, each with equal probability. For more on streaks, see the probability of 4 heads in a row.
What is a sample space in coin flipping?
The sample space is the complete list of possible outcomes. For two flips it’s {HH, HT, TH, TT}. A coin flip outcomes table is simply the sample space written out in rows, which is why counting its rows gives you the total number of possibilities.
Does a coin flip outcomes table work for an unfair coin?
The table of possible outcomes stays the same, but the rows are no longer equally likely. If heads has a 70% chance, HH has a probability of 0.7 × 0.7 = 0.49, not 1/4. You’d need to multiply probabilities instead of just counting rows.
Why don’t 10 real flips split exactly 5 and 5?
Because short runs are noisy. With 10 flips, a perfect 5-5 split happens only about 24.6% of the time. The table describes long-run behaviour. Small samples regularly drift away from 50/50 and tend to even out only as flips pile up.

Related Articles

How to Flip a Coin: 5 Easy, Proven Steps (Hand & Digital)
How to flip a coin: rest the coin on your curled index finger, tuck your thumb behind it, then flick upward so it spins in the…
Outcomes in 3 Coin Flips: All 8 Listed
Outcomes in 3 Coin Flips.Quick answer: The outcomes in 3 coin flips of a fair coin are HHH, HHT, HTH, HTT, THH, THT, TTH and TTT.…
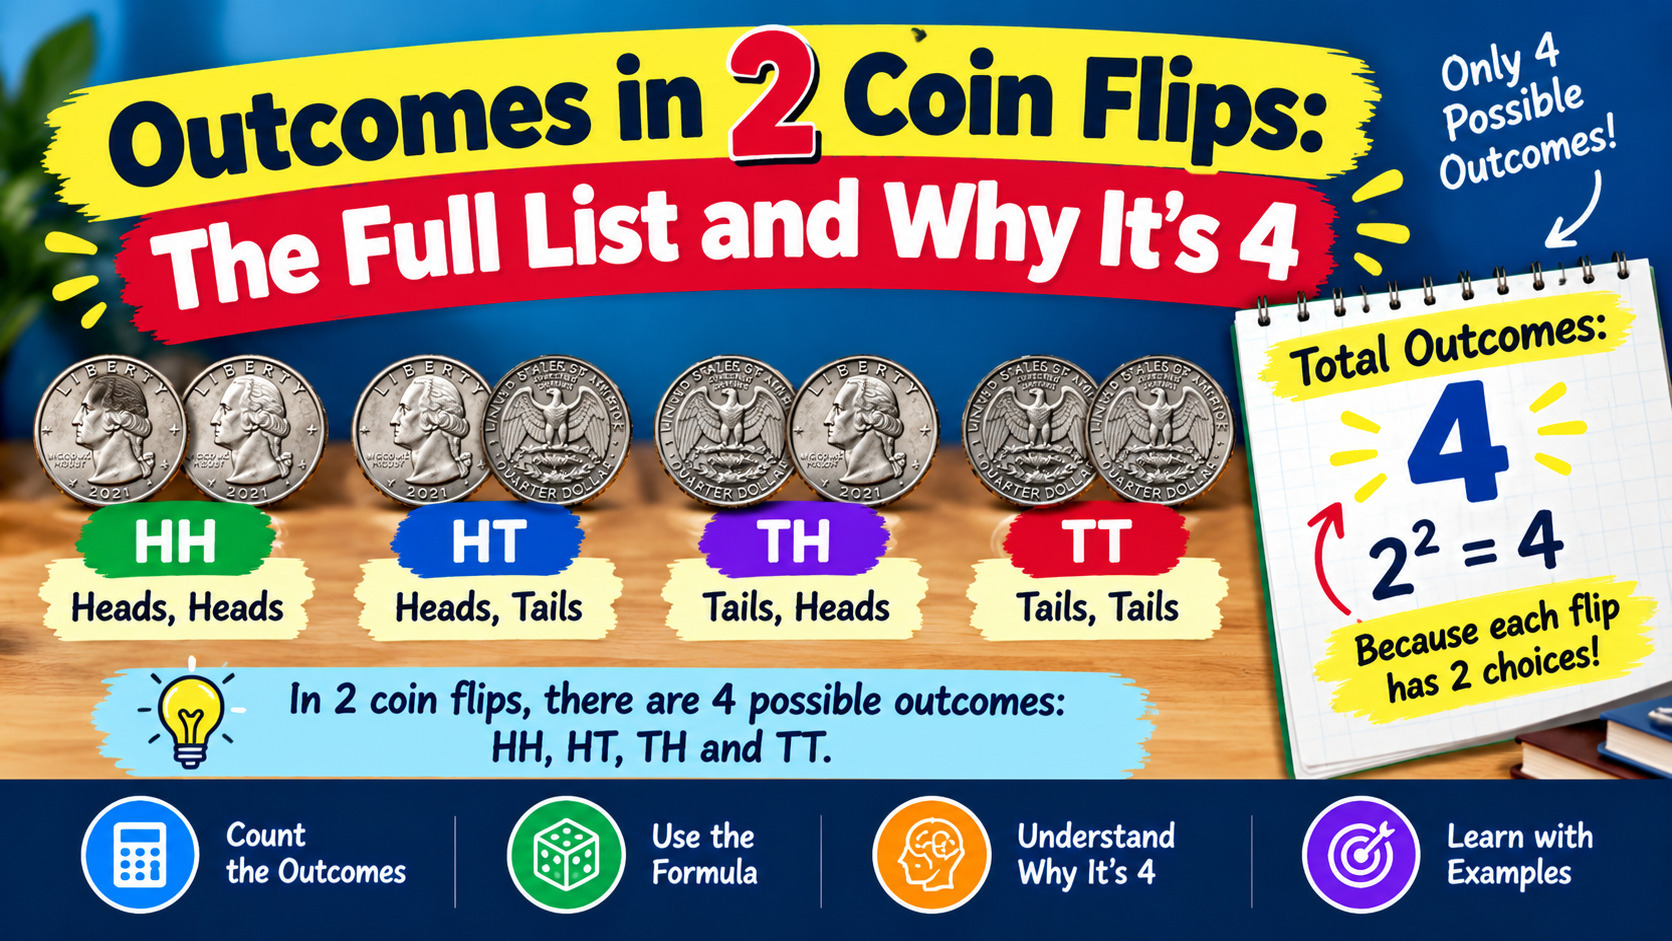
Outcomes in 2 Coin Flips: The Full List and Why It’s 4
Outcomes in 2 Coin Flips..Quick answer: The outcomes in 2 coin flips of a fair coin are HH, HT, TH and TT. That’s 4 equally likely…
Need a Quick Decision?
Flip a coin and let chance decide — instantly, honestly, and for free.
Flip a Coin