
Probability Chart for Heads in a Row: Odds, Formula & Calculator Guide
 Updated November 11, 2026
12 min read
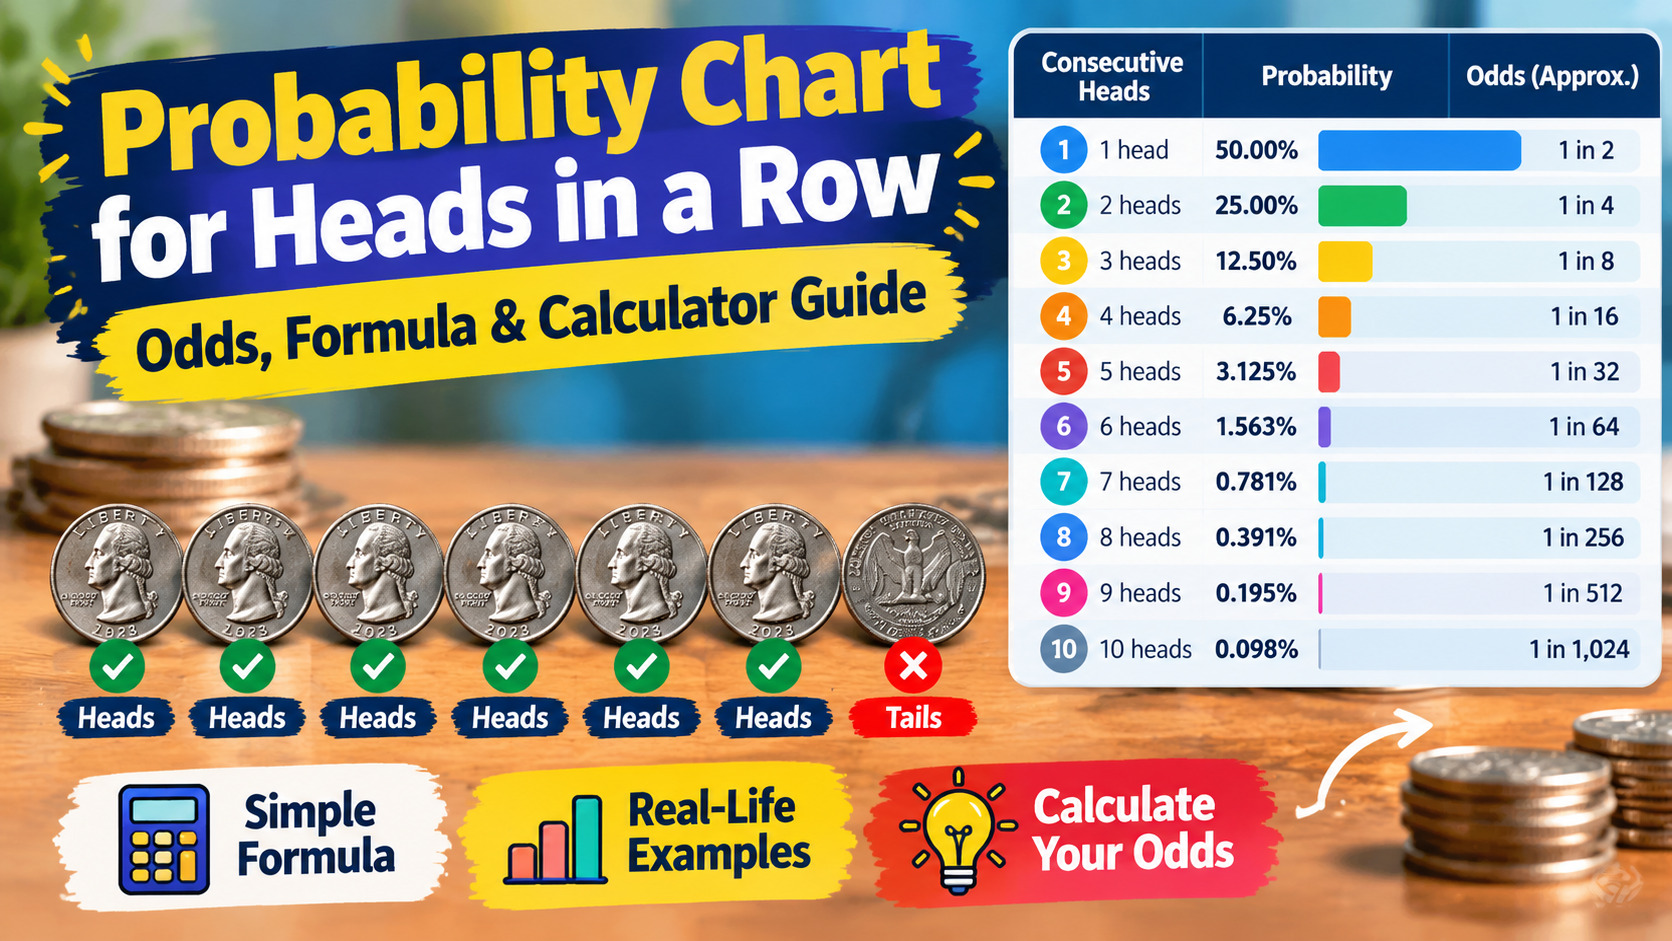
Probability Chart for Heads in a Row: Odds, Formula & Calculator Guide.Have you ever flipped a coin four, five or six times in a row and gotten heads each time, and wondered exactly how unusual it truly is? That’s why we have a graphic of the likelihood of getting heads in a row. It is a graph showing the mathematical probability of flipping heads in a row for various numbers of flips.
Read along the chart and you will notice the odds fall fast, from a comfortable 50% for one heads to a minuscule fraction of a percent by ten. This site assumes a fair coin and independent flips, that is, one flip does not affect the next. With those two basic rules, the math is clean and clear.
Here’s a full chart for 1 to 20 heads, the formula that creates it, a plain-English overview at how streak calculators function, and the mix-ups that trip people up. Flip-a-Coin.us has a coin flip probability calculator style tool and the free flipper that makes it easy to compare your personal flips with the chart.
What a Heads in a Row Probability Chart Tells Us
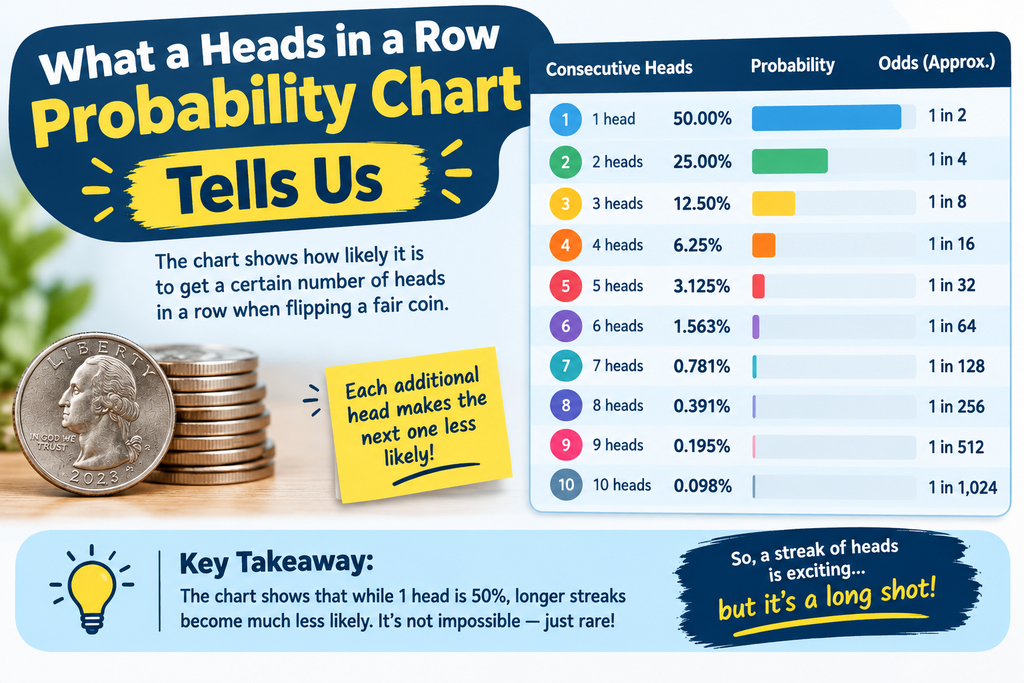
The heads in a row probability chart is a table that tells you the possibility of receiving heads on every flip of a run . The odds for a fair coin are cut in half with each additional heads — from 50% for a single heads, to 3.125% for five.
Simply put, the chart answers a question: what is the chance of getting heads on all of my next n flips if I need them? For one flip the solution is 1/2. For 2 flips you need heads . Then heads again . 1/4 . Every additional flip you ask for decreases the odds in half . And that is the explanation for every number in the chart .
People seek for this kind of graphic because streaks seem important, and a table converts a gut sensation into a statistic. If you want to see a few flips before you look at the table, a heads or tails generator is a simple method to get a feel for how a fair coin operates. For a refresher on the basics, see Khan Academy’s free classes on probability principles.
Probability Table 1 to 20 Heads in a Row
The likelihood of getting 5 heads in a row with a fair coin is 1/32, or 3.125%. So out of 32 sets of 5 flips you’d anticipate around one to be all heads. Ten in a row lowers to 1/1,024, or around 0.098%.
Here’s the full heads in a row probability table, with the fraction, the percentage and a rough “1 in” figure for those who prefer to think in odds.
| Heads in a row | Probability (fraction) | % chance | about 1 in |
| 1 | 1/2 | 50% | 2 |
| 2 | 1/4 | 25% | 4 |
| 3 | 1/8 | 12.5% | 8 |
| 4 | 1/16 | 6.25% | 16 |
| 5 | 1/32 | 3.125% | 32 |
| 6 | 1/64 | 1.5625% | 64 |
| 7 | 1/128 | 0.78125% | 128 |
| 8 | 1/256 | 0.390625% | 256 |
| 9 | 1/512 | 0.1953% | 512 |
| 10 | 1/1,024 | 0.0977% | 1,024 |
| 11 | 1/2,048 | 0.0488% | 2,048 |
| 12 | 1/4,096 | 0.0244% | 4,096 |
| 13 | 1/8,192 | 0.0122% | 8,192 |
| 14 | 1/16,384 | 0.0061% | 16,384 |
| 15 | 1/32,768 | 0.0031% | 32,768 |
| 16 | 1/65,536 | 0.0015% | 65,536 |
| 17 | 1/131,072 | 0.00076% | 131,072 |
| 18 | 1/262,144 | 0.00038% | 262,144 |
| 19 | 1/524,288 | 0.00019% | 524,288 |
| 20 | 1/1,048,576 | 0.000095% | 1,048,576 |
To read it, use the amount of heads you want in the first column and read across. Five heads in a row is 3.125%. The odds of getting heads ten times in a row are around 0.098% or less than one in a thousand. The chances of getting heads 20 times in a row are about 1 in a million. Each row is exactly half of the row above, explaining the rapid decrease in the % column.
One little remark on wording: The likelihood is “1 in 32”. The chances are 31 to 1 against five heads, in strict betting odds. People tend to use the two interchangeably and as long as you know which one you mean, no harm done.
Heads in a Row Chart with Formula Probability
“All the numbers in the table are derived from one formula:
P = (1/2)n
Here P is the probability of flipping n heads in a row from a fair coin, where n is the number of consecutive flips. You are multiplying 1/2 by itself n times . That’s the usual coin-flip formula for streaks.
Say, for instance, five heads. (1/2) ^ 5 = 1/2 * 1/2 * 1/2 * 1/2 * 1/2 = 1/32 which is 3.125% if you divide and multiply by 100.
Why multiply? The flips are independent, and when you have independent events you enhance their individual odds. Another way to look at it is to count. There are 2^5 = 32 distinct ways that five flips can land, but only one of them is HHHHH.
What makes the probability drop so sharply? That’s because it decays exponentially. Each additional flip halves what you have left thus after 10 flips you have halved 10 times and after 20 you have halved 20 times. That’s why the chart goes from percentages you can imagine to values that appear like rounding mistakes. For more on the arithmetic, there’s a page on coin flipping on Wolfram MathWorld.
Streak Probability Calculator Heads
A heads streak probability calculator does the same thing as the formula , just without the lookup . This is how it would be done on the web, and this is how you would do it by hand.
- You tell it how many heads in a row you want, like 7.
- The instrument elevates 1/2 to that power ( 1/2 ) ^ 7 = 1/128.
- The answer is turned into a decimal and a percentage: 0.0078125 or 0.78125%.
- It gives the answer, usually as a fraction and a percentage.
On a standard calculator you would enter 0.5 by hand, increase it to the 7th power, then multiply by 100. Either way, same effect. A calculator is handy since it checks your calculations, helps you compare many streak lengths in seconds, and builds a feel for how quickly the chances fall.
What a calculator cannot do is predict the next flip. All it shows you is how likely a streak is across many tries. Nothing more. If you want to see streaks occur live, you can use a coin toss simulator like Flip-a-Coin.us, a flip-and-test program that provides you random results to count and compare with the chart. If you are also looking for a general probability calculator for other types of questions, seek for one that allows you to select the likelihood of heads manually, since a biased coin uses a different number than 1/2.
Exact, Minimum, and Numerous Flips Sequences
The chart addresses one particular subject, thus it’s useful to distinguish between three that sound alike.
Five heads in five rolls. It means HHHHH and nothing else. The probability is 1/32, or 3.125%. The probability of five of the same side, HHHHH or TTTTT is 2/32, or 6.25%.
5 in a row exactly and 5 or more in a row. Imagine six tosses. So a streak of exactly five heads can occur as HHHHHT or THHHHH. That is 2 out of 64 or 3.125 %. A run of at least five means HHHHHH, therefore it’s 3 of 64, or around 4.7%.
A streak somewhere within many flips. This is the one that surprises people.” Any particular run of flips is rare , but a longer sequence provides a streak lots of locations to start , so the chances go up quickly .
| Scenario | Probability |
| Probability 5 heads in 5 flips exactly | 3.125% |
| Run of 5+ heads in 10 flips | 11% |
| 5+ heads in 20 flips | (25% chance) |
| 8+ heads in 30 flips | (12% chance) |
| Run of 5+ heads in about 100 tosses | about 80% |
| Run of 10+ heads somewhere in 100 flips | ~ 4% |
| Run of 10+ heads somewhere in 1,000 tosses | about 38% |
A good rule of thumb: the longest run of heads you should expect to see in n flips is around the base 2 log of n . That comes to about 6 in 100 flips and about 9 in 1,000 flips. If this piqued your interest, coin flip stats from extended runs are a fantastic start to dig.
Streaks Heads in the Real World
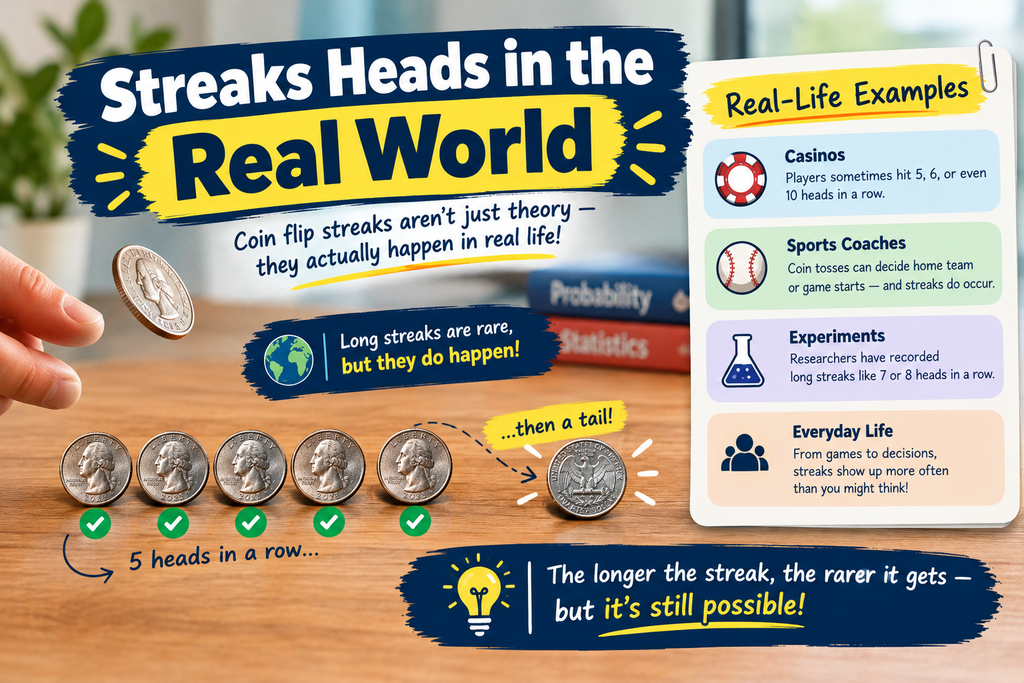
Imagine a classroom with 32 students. Each student flips a coin five times and tells us if they got all heads. Each has a 1 in 32 chance, so you’d expect around one pupil to succeed, and about a 64% likelihood that at least one succeeds. It would be no surprise to see two or three. This kind of activity teaches independence better than any formula.
The same mistake happens on roulette tables where players feel red is “due” following a long run of black. The wheel is like the coin, amnesiac. Sports fans connect coin streaks to winning streaks. It’s a loose parallel because teams aren’t coins and games aren’t quite 50/50, but the want to interpret meaning into a run is the same.
Any yes-or-no random event in statistics classrooms and computer simulations is modeled by coin flips. Students experience the exponential decay with their own eyes, by running a random coin flip a large number of times. And if you’re wondering how long you’d wait for a long streak, you’re looking at an average of roughly 2,046 flips to see ten heads in a row for the first time, but that’s just an average. You can notice it after 200 flips or 5,000.
Here’s an experiment you can try yourself. Flip a coin five times and see whether all are heads. Repeat that 50 times. You should expect to see about one or two all-heads rounds, but your actual number will vary. Short studies are noisy, and as you get more data the results tend toward 3.125%.
Mythos About Heads Streaks
Some thoughts come back again and again so let’s tackle them front on.
Does more heads make tails more likely? No. This is the gambler’s fallacy, the concept that a streak renders the opposite result “due.” After 5 heads the next flip is still 50 % heads , 50 % tails . The chart is showing the odds of the full streak before it starts, not the odds of the following flip.
Does a coin get rigged after a streak? No, by itself. Such streaks are a natural feature of random sequences. A very long run, say 20 heads in a row, would be a good reason to assume the coin is biased, since on a fair coin it occurs roughly once in a million trials.
Does probability recall the past results? Nope. A coin has no memory. Every flip is a new, independent occurrence. Randomness does not even itself out on any schedule. The National Institute of Standards and Technology publishes research on randomness, and Britannica offers a decent review of probability theory. One more reminder: The statistics on this page are mathematical expectations for a fair coin, actual trials will differ.
Conclusions
The heads in a row probability chart boils down to one concept . Every additional heads halves the likelihood . That is, from 50% for 1 flip to 3.125% for 5, 0.098% for 10, and around one in a million for 20, all from the single formula P = (1/2)^n.
Three reminders will spare you from the common pitfalls. Yes, but this is one particular run of flips. A streak somewhere in a long series of flips is considerably more likely. A streak never alters the following flip which is always 50/50. Feel free to use the free coin flip tool online https://flip-a-coin.us/ and compare real random flips with the chart.
What is heads in a row probability graphs?
A heads in a row probability chart is a table that depicts the probability, mathematically, of flipping heads a number of times in a row. Typically with a percentage next to each, it shows values such as 1/2 for one heads, 1/4 for two and 1/32 for five for a fair coin.
What is the likelihood of getting consecutive heads?
For each flip in the streak, double the odds of heads, 1/2, by itself. The formula is P = 1/2^n . n is the number of heads in a row . For example, 4 heads in a row is (1/2)4 = 1/16 = 6.25%. It works because the flips are independent.
What are the odds of flipping 10 heads in a row?
With a fair coin, the odds of flipping 10 heads in a succession is 1/1,024 or around .098%. You work it out as (1/2)¹⁰ . That’s about one chance in a thousand of getting a particular set of ten flips, however a streak anywhere in a lot of flips is more likely.
What are the chances of obtaining 20 heads in a row?
The odds of flipping 20 heads in a row are 1 in 1,048,576 . That’s around 0.000095% . That’s 1,048,575 to 1 against in pure betting odds. A fair coin can do it, but it is quite rare and people may suspect a biased coin for such a long run.
What are the chances of flipping a coin and getting heads five times in a row?
Not very common, but not very rare. If you do 5 flips , the chance is merely 3.125 % for one set . But over longer durations, streaks with five heads occur frequently. In 100 coin flips, there will be runs of 5 or more heads about 80% of the time, thus people see them a lot.
How does a heads streak odds calculator function?
A heads streak calculator multiplies how many heads you entered in a row, by the power of 1/2 to give you the answer in fraction and percentage. It computes for 7 heads (1/2) 7 = 1/128, or 0.78%. It can only tell you the probability and it can never tell you what each specific flip will be.
Are tails and heads equally likely?
For a fair coin, sure. There are two possibilities that are equally likely, heads and tails, and the chance of heads on each flip is 50%. In practice real coins are slightly biased, for example by tending to land on the side they started on but these effects are quite minimal.
Does the outcome of prior coin flips influence the results of future coin flips?
No. Each coin flip is an independent event, therefore the previous results have no bearing on the following one. If you flip heads 5 times in a row , the next flip is still a 50/50 heads or tails . That is the fallacy of the gambler. A coin has no memory of what has happened before.

Related Articles

Is Heads or Tails More Likely? 7 Proven Facts
Is heads or tails more likely? No. On a fair coin, heads and tails each have a 50% chance, so neither wins more over time. The…

Is Heads or Tails Good Luck? 7 Surprising Truths
Is heads or tails good luck? No. On a fair coin, heads and tails each land about 50% of the time, so neither side is luckier,…

Flip a Coin 10 Times: What to Expect from 10, 20, 30 and 50 Flips
If you flip a coin 10 times, you’ll most often land on about 5 heads, but anything from 3 to 7 heads is completely normal. That…
Need a Quick Decision?
Flip a coin and let chance decide — instantly, honestly, and for free.
Flip a Coin