
Probability of 5 Heads in a Row Formula, Percentage & Calculator Guide
 Updated November 11, 2026
11 min read
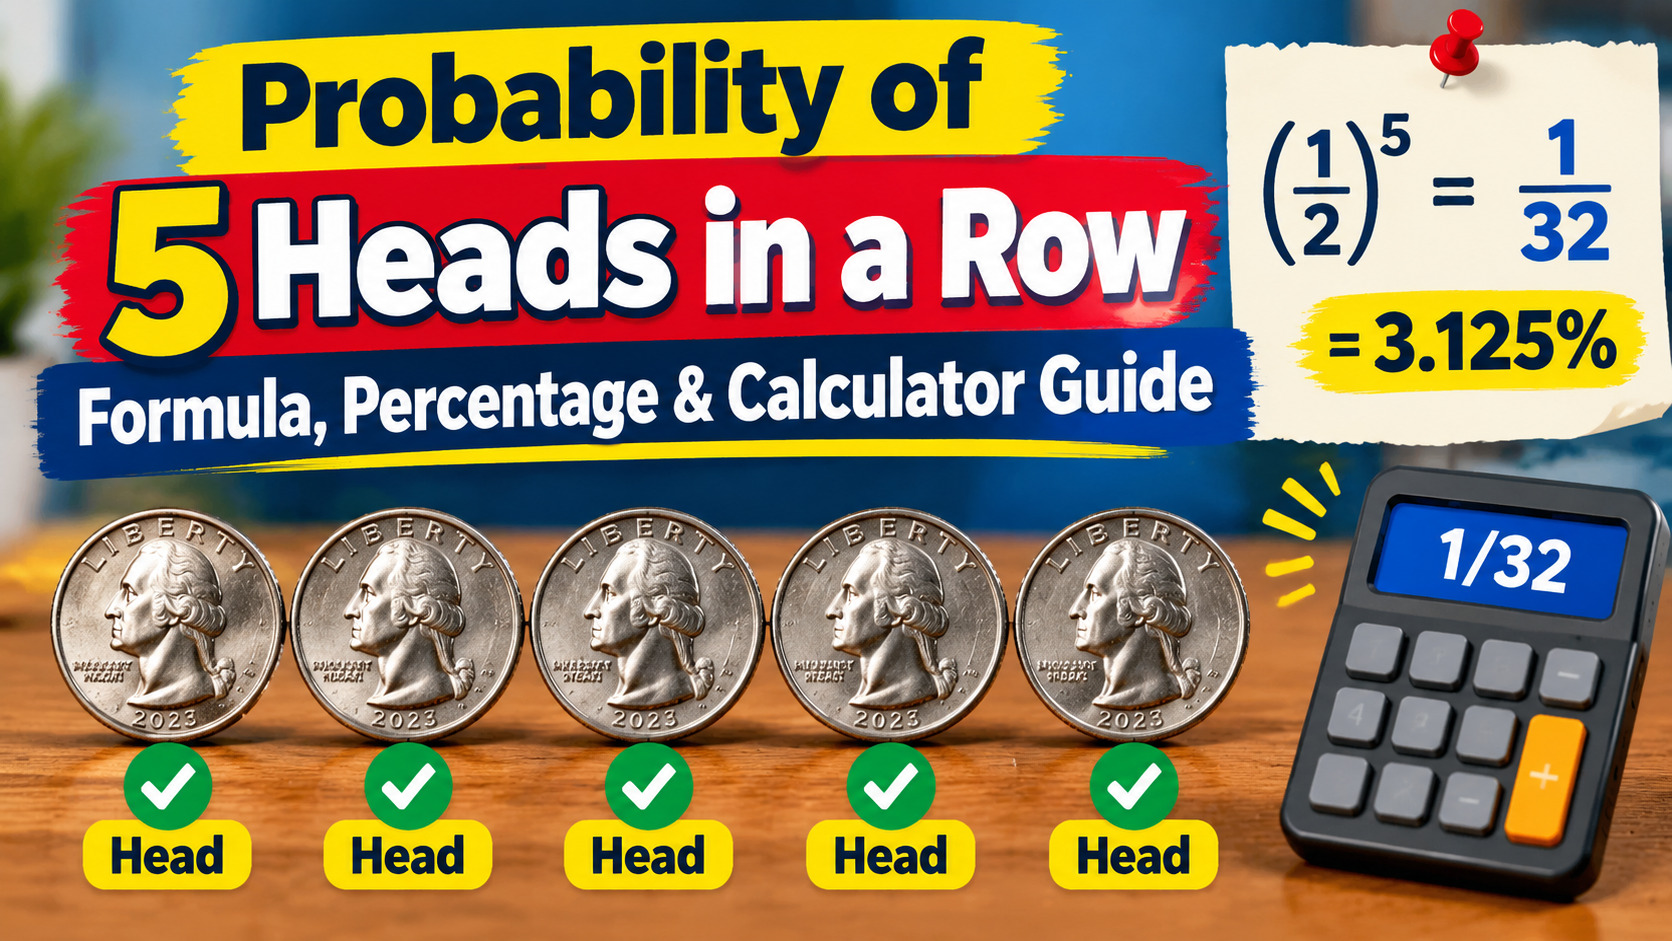
Probability of 5 Heads in a Row Formula, Percentage & Calculator Guide..You flip a coin. It falls tails. Then again, and again, and next thing you know you’re looking at 5 tails in a row. It feels like something unusual is going on but is there?
The odds of getting 5 tails in a row is 1 in 32 or 3.125%. That’s around three possibilities in a hundred. Low enough to be extraordinary, high enough that it happens to somebody all the time. If you just saw it happen and are wondering whether the coin was rigged, the odds say probably not.
In this guide you’ll find out where 1/32 comes from, how to convert it to a percentage, how to work out any streak manually, and why tails in a row will never influence the next flip. A coin flip probability calculator style tool is useful to examine the math and the free flipper at Flip-a-Coin.us lets you try streaks with real random flips as you read.
What Is 5 Tails in a Row Probability?
The likelihood of Five Tails in a Row is the mathematical probability of a fair coin landing tails five times in a row without any heads in between.
Short answer : The odds of flipping 5 tails in a succession on a fair coin is 1 / 32 , or 3.125 % . That is, if you flipped a coin five times, about 3 out of every 100 times all five flips would come up tails.
A fair coin has two possible outcomes, heads and tails, both with 50% chance on each flip. We also assume that the flips are independent, i.e. one flip does not affect the next. If we make those two assumptions the math is fairly clean. Khan Academy includes free classes on the basics of probability for a quick review.
But why is the probability = 1/32?
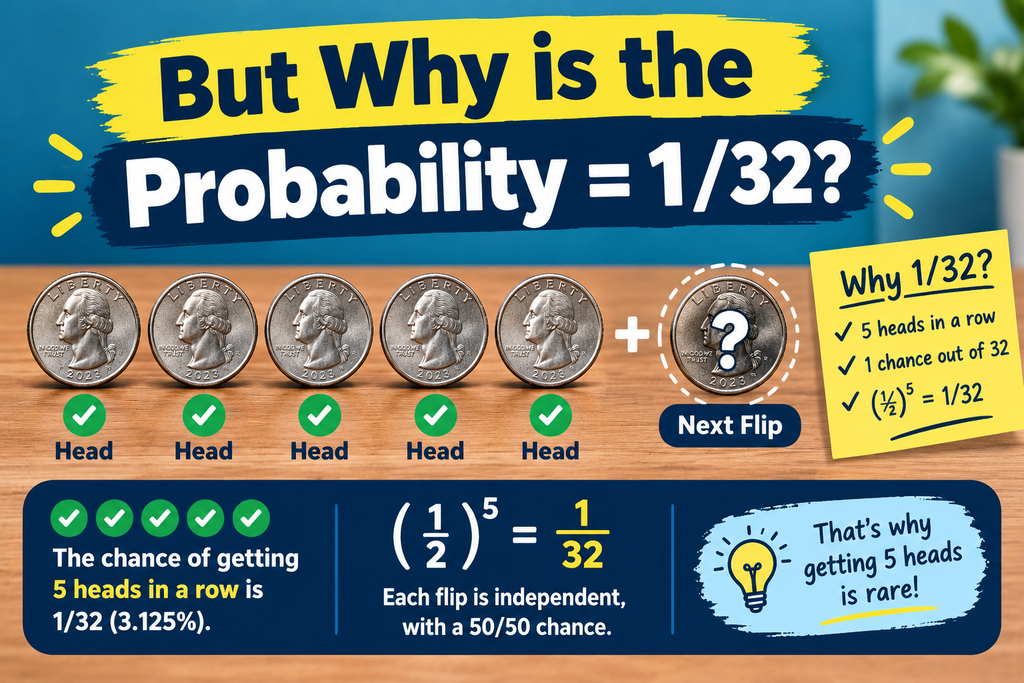
The number is of multiplication. The odds of tails on one flip is 1/2 . If the occurrences are independent, you multiply their individual odds to obtain the odds that they all take place. So the odds of flipping 5 heads in a row is 1/2 x 1/2 x 1/2 x 1/2 x 1/2 = 1/32.
Here is another way to see this, using counting. There are 2⁵ = 32 possible sequences of outcomes for five flips, and each is equally likely. One is TTTTT, and only one. So the odds are 32 to 1. If you want to see more deeply into how coin flips operate, this counting principle is at the center of it.
There’s a twist that surprises people. A sequence like HTTHT, which looks untidy, is as improbable as TTTTT. Each particular sequence of 5 flips has a 1/32 chance. We simply observe the streak as it creates a pattern.
5 Wins in a Row Chance Percentage and How Rare It Is
To convert 1/32 to a percentage you divide and multiply by 100. So , one divided by 32 is 0.03125 . 0.03125 times 100 provides 3.125 % . So, the chance percentage for 5 tails in a row is 3.125%.
It’s satisfying to watch the number go down, one flip at a time. The less chance you have the more tails you need.
| Tails in a row | Fraction | Percentage |
| 1 | 1/2 | 50% |
| 2 | 1/4 | 25% |
| 3 | 1/8 | 12.5% |
| 4 | 1/16 | 6.25% |
| 5 | 1/32 | 3.125% |
These numbers are cumulative . So each row shows how likely it is that all the flips so far have been tails . They also answer the issue of how frequent 5 tails in a row is: it is rare on one try. But the rarer it becomes, the more chances you give it. If 32 people flip a coin 5 times each, the probability that at least one person receives 5 tails is around 64%. With 100 persons that goes up to something like 96%. Hence it seldom happens to any one person, but almost often to a crowd.
A quick word on phrasing. 1 in 32 odds. The odds against are 31 to 1 . There is one way for it to happen and 31 ways for it not to . Both formulations refer to the same fact, but usually people mean the chance.
5 Tails in a Row Odds Calculator: One Step at a Time
A 5 tails in a row probability calculator is basically just one brief formula. The possibility of a streak of n tails in a row with a fair coin is P = (1/2)^n, since the probability of tails on one flip is 1/2 and there are n flips in the streak. Here’s the version broken down step-by-step, answer at bottom.
- The probability of getting tails on one flip: 1/2, or 0.5.
- Select how many tails in a row you want. Here, n = 5.
- 0.5 to the power of 5: 0.5⁵ = 0.03125.
- Multiply by 100 to make it a percentage . 0.03125 x 100 = 3.125 %
So the probability of 5 tails in a row calculator answer: 1/32, which is 3.125%. This may be done on any conventional calculator by inputting 0.5, raising it to the 5th power, then multiplying by 100.
The same formula holds for every streak. Three tails in a row equals ( 1/2 ) ^ 3 1/8 , or 12.5 % . Ten tails in a row equals (1/2)¹⁰ = 1/1,024, which is around 0.1%. An online streak calculator simply performs this for you: you type in the length of the streak, it raises 1/2 to that power, and it presents the answer as a fraction and a percentage.
What a calculator cannot do is tell you what the next flip will be. It measures the probability of a streak over numerous tries. If you want to truly watch streaks happen, try a coin toss simulator like Flip-a-Coin.us, a flip-and-see program that gives you random results and lets you keep track of your own runs of tails.
5 Tails in Many Flips vs. 5 Tails vs. at Least 5 Tails
The most common source of confusion is that the phrase “ 5 tails in a row “ might signify three somewhat different things .
Getting exactly 5 tails in five flips indicates you flipped five times, and each flip was tails. Your chances are 1/32, or 3.125%.
5 exactly vs 5 or more in the long run. Suppose you flip 6 times. Exactly 5 tails in a row can be TTTTTH or HTTTTT, which is 2 out of 64, or 3.125%. TTTTTT is a run of at least five tails, therefore that one too is included, making it 3 out of 64, or around 4.7%.
A streak somewhere between a lot of flips. A lengthier sequence provides a streak a lot of locations to start . So the odds increase rapidly .
| Number of flips | Chance of a run of 5 or more tails someplace |
| 5 | 3.125% |
| 10 | around 11% |
| 20 | about 25% |
| 100 | roughly 80% |
The essential thing is that 3.125% is just one set out of five flips. The odds of a streak occurring somewhere in a long series are far greater. That is the difference between 5 in a row and 5 or more in a row, and that is why streaks keep popping up in real data.
Probability of Getting Exactly 5 Heads in a Row
You could wonder about heads as well. The likelihood of flipping 5 heads in a row is also 1/32, or 3.125%, because a fair coin has equal probability for each side. The arithmetic is the same. (1/2)^5.
That means five tails in a row is no more probable than five heads in a row. They draw. The likelihood of getting five of the same face, heads or tails, is 1/32 + 1/32 = 2/32 or 6.25%. For more on how the two compare, check our guide to heads or tails likelihood.
Why Previous Flips Don’t Matter for the Next One
Many of us think that heads must be coming after four tails in a row. It is not. Each coin flip is an individual event and a coin has no memory of what it did a second earlier.
The 1/32 number is the entire five-flip sequence before you begin. Once four tails have landed, there is only one flip left and that flip is 50% tails and 50% heads, exactly as usual. The probability of a fifth tail to break the streak is only 1/2. After a run of five tails, the chances of heads or tails are still 50/50.
This erroneous assumption is known as the gambler’s fallacy, the perception that a streak means that the opposite result is “due.” Randomness doesn’t average out on a schedule. One caveat: a really lengthy streak, say 20 tails in a row, occurs about once in a million tosses with a fair coin, so at that point you may reasonably suspect that the coin is biased.
If you are interested in an overview of the topics presented here, Britannica has a summary of probability theory and the National Institute of Standards and Technology publishes research on randomness.
Real-Life Examples of Coin Flip Streaks

Imagine a class of 32 students. Each of them flips a coin 5 times and tells you if they got all tails. Each kid has a 1 in 32 chance, so you’d expect around one student to do it and it wouldn’t surprise to see two. Seeing things happen makes independence feel genuine in a way a formula can’t.
The same mistake occurs at roulette tables, where gamblers mistakenly believe that red is “due” after a run of black. The wheel, like the coin, forgets. Fans remark about hot streaks in sports, comparing them to coin runs. The analogy is a little vague, as teams aren’t coins and games aren’t quite 50/50, but the impulse to put significance into a run is the same.
Streaks are especially important in random simulations and statistics classrooms, where coin flips are the default model for any yes-or-no occurrence. To see how streaks behave over longer runs, you can flip a coin online using an online coin flip generator, and count them yourself. Or check out coin flip statistics for more examples. For more math see the coin tossing page at Wolfram MathWorld.
What if the coin is biased? What if tails comes up 60% of the time? Then five tails in a row is (0.6)^5 = 7.776%, considerably more than 3.125%. You use the same formula, except with 0.6 in place of 0.5. That’s why the “1 in 32” number is for a fair coin and nothing else.
You can experiment with this. Now, flip a coin five times, repeatedly, and see if you got all tails. Do that fifty times. You should expect to witness one or two all-tails rounds (although the precise number will vary). Short tests are noisy, but findings converge to about 3.125% as you have more data. The numbers in this guide are the expected values for a fair coin with separate flips; real trials will differ.
Conclusion
The probability of flipping five tails in a row with a fair coin is 1/32, or 3.125%, and the formula for it is merely (1/2)⁵. Five heads in a row is just as likely. It is hard to get one try , but it is much more frequent to get a streak somewhere among several flips . That is why you keep getting extended runs . And no matter how long the streak you observe, the next flip is always 50/50 since a coin never recalls what it did.
Check out streak probability with real random flips using our free online coin flip tool at https://flip-a-coin.us/
What Are the Odds of 5 Tails in a Row?
The odds of flipping 5 tails in a row with a fair coin is 1 in 32, or 3.125%. You work it out by taking the risk of getting tails, which is 1/2, and multiplying it by itself five times: ( 1/2 ) ^ 5 . Every flip is independent hence the probability is the same for any collection of 5 consecutive flips.
Is Getting 5 Tails in a Row Rare?
It’s not really rare but it’s not common. This means the chance of one set of five flips is merely 3.125%. But with 32 people flipping 5 times each, around 64% of the time someone gets all tails. In 100 flips, there’s around an 80% chance of getting a run of five or more tails.
What Are the Chances of Flipping 5 Tails in a Row?
The likelihood of flipping tails 5 times in a row with a fair coin is 3.125%, or 1 in 32. There are 32 different sequences of 5 flips. Only 1 of those is all tails. The outcome is (1/2)^5.
5 Tails in a Succession: Is That More Common Than 5 Heads?
No. On a fair coin, heads and tails are both 50%, so 5 heads in a row and 5 tails in a row are both 1/32, or 3.125%. Neither streak is more frequent, and the probability of any given sequence of five flips is the same.
How to Calculate the Likelihood of a Coin Flip Streak
Multiply the odds of a single outcome by itself for each flip in the streak. For a fair coin, the formula is (1/2)ⁿ where n is the length of the streak. 5 in a row equals (1/2)⁵ = 1/32 = 3.125%. Ten in a row is (1/2) 10 , or around 0.1%.
Does a Coin Flip Calculator Indicate Probability?
Yup. For example, a coin flip calculator displays probability by applying the formula, such as (1/2)^5 for five tails in a row. A simulator is different . It generates random flips so you can see what happens yourself . Each flip is independent of the others, so you can’t use one to anticipate the next.
If You Got a Bunch of Tails, Is It More Likely to Receive Heads?
No. Each flip is independent, so that the previous result has no effect on the following one. The next flip after 5 tails is still 50% heads and 50% tails. The gambler’s fallacy is the belief that heads is due. Streaks don’t change the odds . A coin has no memory .

Related Articles

Is Heads or Tails More Likely? 7 Proven Facts
Is heads or tails more likely? No. On a fair coin, heads and tails each have a 50% chance, so neither wins more over time. The…

Is Heads or Tails Good Luck? 7 Surprising Truths
Is heads or tails good luck? No. On a fair coin, heads and tails each land about 50% of the time, so neither side is luckier,…

Flip a Coin 10 Times: What to Expect from 10, 20, 30 and 50 Flips
If you flip a coin 10 times, you’ll most often land on about 5 heads, but anything from 3 to 7 heads is completely normal. That…
Need a Quick Decision?
Flip a coin and let chance decide — instantly, honestly, and for free.
Flip a Coin