
Coin Flip Streaks Explained: Why They Happen and How to Calculate the Odds
 10 min read

Coin Flip Streaks Explained: Why They Happen and How to Calculate the Odds..Coin flip streaks explained in one line: they’re normal, and they show up in fair flips more often than you’d think. Say you flip a coin 8 times and get 6 heads. Rigged? No. Six or more heads happens about 14% of the time with a fair coin.
Streaks feel odd because our brains love patterns. But a coin has no memory. In this guide, you’ll see why streaks happen, how to work out the odds, and what the numbers look like over 20, 50 and 100 flips. I also ran a simulation to check the math. Want the basics first? Start with our probability basics guide.
What Is a Coin Flip Streak?
A coin flip streak is a run of the same result in a row, like heads, heads, heads, heads. Statisticians call it a run. The length of the streak is how many matching flips sit side by side. Four heads in a row is a streak of length four.
A streak can be heads or tails. Three tails in a row counts too. It ends the moment the other side shows up. So H-H-H-T holds a streak of three, and the T starts a new streak of one.
Coin Flip Streaks Explained Simply
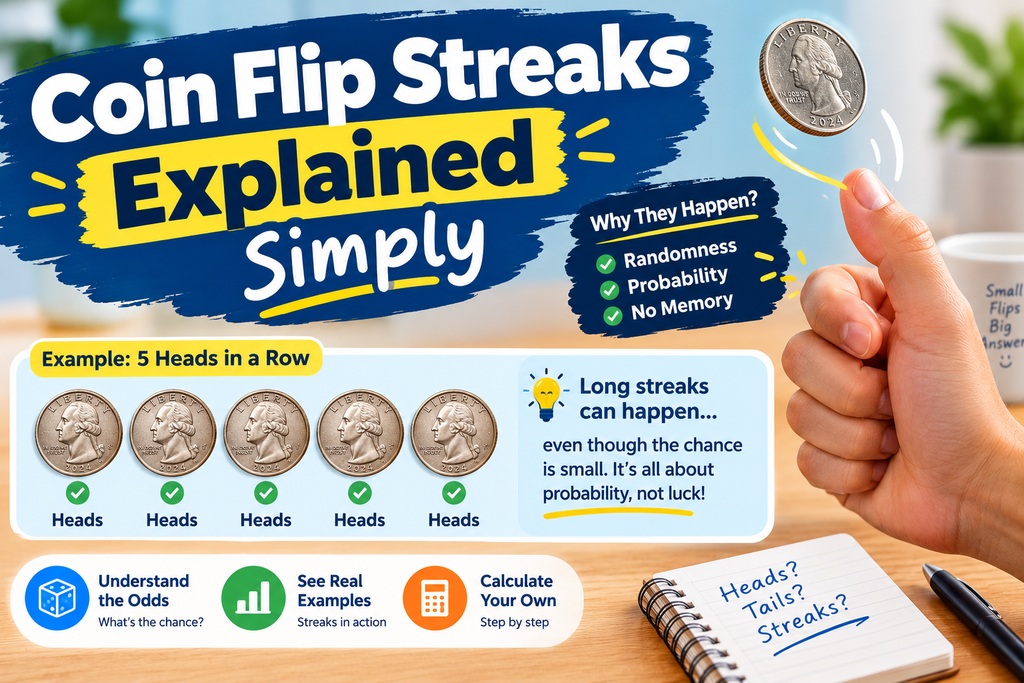
A streak is just luck lining up. There’s no hidden cause behind it.
Here’s a real-life version. Picture a cricket captain who wins the toss three matches running. Fans start saying he owns a lucky coin. But the coin doesn’t know who won last time. Every toss starts fresh at 50-50.
Now flip a coin 100 times. That gives you 100 chances to start a streak. With that many chances, a few long runs are almost sure to appear.
That’s the heart of coin flip streaks for beginners. Each flip stands alone, and lots of flips give lots of chances.
Why Do Coin Flip Streaks Happen?
Streaks happen because each flip is independent, and long sequences give streaks many chances to appear. “Independent” just means one result doesn’t change the next. You can see this in action in our guide on how a random coin flip works. For extra practice, Khan Academy has free probability lessons.
Here are the four main reasons:
- Flips are independent. The coin doesn’t remember what it did a second ago.
- More flips mean more chances. Every flip is a new spot where a streak can begin.
- Our brains chase patterns. We remember a run of heads and forget a messy mix.
- Small samples look lumpy. In 10 flips, a perfect 5-5 split happens only about 25% of the time.
You may have heard of the law of large numbers. It says the share of heads drifts toward 50% as the sample size grows. But it doesn’t work by cancelling streaks. New flips just water the old ones down.
So if you see five heads in a row, tails isn’t “due.” The next flip is still 50-50.
Coin Flip Streak Probability Explained
The chance of a specific streak is 1/2 multiplied by itself once for each flip. For n heads in a row, that’s (1/2)^n. Long streaks get rare fast, but many flips give them room to appear.
The Basic Formula
Here’s the coin flip streaks math explained in plain terms. Each flip has two outcomes, so it’s a Bernoulli trial. That’s just a fancy name for any try with two results. Because flips are independent, you multiply the chances together.
P = (1/2)^n
Here, n is the number of flips in your streak. Try two heads: 1/2 × 1/2 = 1/4, or 25%.
If you want to count heads in a set number of flips, like 6 out of 8, you’ll use binomial probability. It’s a way to count all the ways a result can happen. That’s how I got the 14% in the intro.
Worked Examples
Let’s go step by step. Each example asks: what’s the chance the next flips are all heads?
- 3 heads in a row: 1/2 × 1/2 × 1/2 = 1/8 = 12.5%
- 5 heads in a row: 1/2 multiplied five times = 1/32 = 3.1%
- 10 heads in a row: 1/2 multiplied ten times = 1/1,024 = about 0.1%
So what’s the probability of getting 5 heads in a row? About 3.1%, or 1 in 32. And if heads or tails both count, double it. Five of the same side is 1/16, or 6.25%.
Probability of a Streak Somewhere in Many Flips
The chance of at least one streak climbs as you add flips. In 100 flips, a run of 5 or more of the same side shows up about 97% of the time.
Here’s a handy rule. The longest streak in n flips is roughly log2(n). That asks: how many times do you multiply 2 to reach n? For 100 flips, log2(100) is about 6.6. The exact average is closer to 7.
Coin Flip Streaks Probability Chart
These two tables show how fast streaks get rare, and how fast they come back when you flip more. All numbers were calculated with a script, not guessed.
Table 1: Chance the next k flips are all heads
| Streak length (k) | Probability | Odds |
| 2 | 25% | 1 in 4 |
| 3 | 12.5% | 1 in 8 |
| 4 | 6.25% | 1 in 16 |
| 5 | 3.13% | 1 in 32 |
| 6 | 1.56% | 1 in 64 |
| 7 | 0.78% | 1 in 128 |
| 8 | 0.39% | 1 in 256 |
| 9 | 0.20% | 1 in 512 |
| 10 | 0.098% | 1 in 1,024 |
Table 2: Chance of at least one run of k heads or k tails
| Streak length (k) | In 20 flips | In 50 flips | In 100 flips |
| 5 | 45.8% | 82.1% | 97.2% |
| 6 | 23.7% | 54.4% | 80.7% |
| 7 | 11.5% | 30.9% | 54.2% |
| 8 | 5.4% | 16.2% | 31.5% |
| 10 | 1.2% | 4.1% | 8.7% |
Notice the pattern. A run of 10 is a 1-in-1,024 shot for a named start. But in 100 flips, you’ll see one about 9% of the time.
How We Calculated These Numbers
Table 1 uses (1/2)^k. Table 2 uses a step-by-step count of run lengths, described in the calculator section below. I checked the results against the recurrence formula on Wolfram MathWorld, and they matched.
Coin Flip Streak Examples
Streaks of five or more are common once you flip 20 times or more. Here are coin flip streaks explained through three examples, from small to big.
Example 1: 20 flips. Flip a coin 20 times. The chance of at least one run of 5 is 45.8%. Almost a coin toss itself! A run of 6 turns up 23.7% of the time.
Example 2: 100 flips. I ran 1,000 simulated sets of 100 flips each. The longest streak averaged 6.98 flips. The most common longest streak was 6, and the median was 7. The shortest was 4 and the longest was 17. About 97.9% of sets had a run of 5 or more. You can try your own flips with our heads or tails simulator.
Example 3: Basketball. A player makes 5 shots in a row. Is she “hot”? Fans say yes. But even a coin makes runs like that. More on that below.
Coin Flip Streak Calculator Explained
A coin flip streaks probability calculator takes two inputs: the number of flips (n) and the streak length (k). It gives back the chance of at least one run of k. Here’s how it works, with no code.
- Keep a scoreboard. It tracks how long the current streak is: 1, 2, 3, and so on.
- Flip once. Half the time the streak grows by one. Half the time it resets to 1.
- Check for a win. If the streak reaches k, put that chance in a “done” pile.
- Repeat n times. The scoreboard updates after every flip.
- Add up the “done” pile. That total is your answer.
Let’s test it on a tiny case: 3 flips, streak of 2. There are 8 possible sequences. Only H-T-H and T-H-T have no pair in a row. So 6 of 8 have a streak. That’s 75%.
Computer scientists call this dynamic programming. It means solving a big problem by building on smaller ones. Want to see the spread for yourself? Run many flips at once with our coin flip tool.
Common Myths: Gambler’s Fallacy vs. Hot Hand
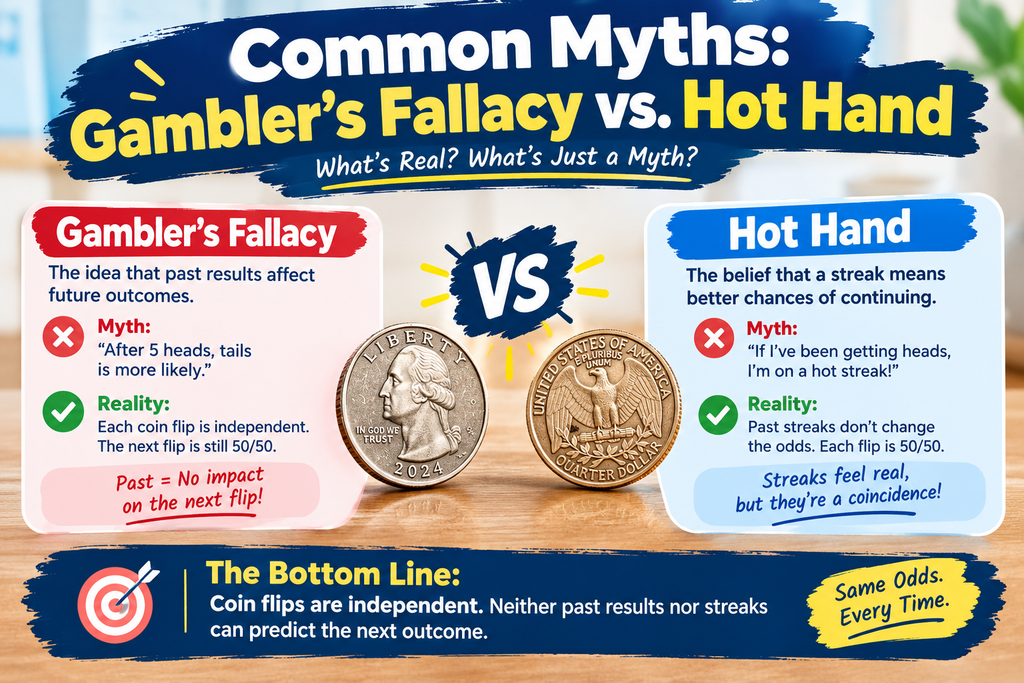
The gambler’s fallacy says a streak must end soon. The hot hand fallacy says a streak will keep going. For a fair coin, both ideas are wrong.
The gambler’s fallacy. After five heads, many people feel tails is due. It isn’t. The coin still has a 50% chance of heads.
The hot hand. This is the belief that someone on a streak is more likely to keep going. In 1985, researchers Gilovich, Vallone and Tversky studied basketball shooting. They said streaks looked like random coin flips. You can read their 1985 hot hand study.
Then, in 2018, Miller and Sanjurjo found a subtle bias in how streaks were measured in short sequences. After fixing it, the old conclusion flipped. Read their Econometrica study.
Does that mean every player gets hot? Not quite. Shooters aren’t coins. Skill and defenders matter. The takeaway is simple: a coin has no hot hand, and judging streaks takes care.
Key Takeaways
Coin flip streaks explained in five lines:
- A coin flip streak is a run of the same result, and fair coins make them all the time.
- The odds of a named streak of n flips is (1/2)^n, so five heads is 1 in 32.
- More flips mean more chances. In 100 flips, a run of 5 or more shows up about 97% of the time.
- The longest streak in 100 flips is usually 6 or 7. A coin never owes you a switch.
Want more? Browse more coin flip guides on our blog.
Are coin flip streaks really random?
Yes. In a fair coin, streaks are a normal part of randomness. Each flip is independent, so earlier results don’t change the next one. Over many flips, runs of the same side appear on their own. A streak by itself doesn’t mean the coin is rigged or the flips are fixed.
What is the probability of 5 heads in a row?
It’s 1 in 32, or about 3.1%, for five flips you name in advance. You get it by multiplying 1/2 five times. If five of the same side counts, heads or tails, the chance doubles to 1 in 16, or 6.25%. Over 100 flips, a run of five is very likely.
What is the longest streak in 100 coin flips?
Usually 6 or 7. The average is about 7, and the exact math agrees. In my 1,000 simulated sets, the longest streak ranged from 4 to 17. A run of 10 or more showed up in about 8% of sets. So don’t be shocked by a streak of 7.
Does a streak make the next flip more likely to switch?
No. A streak doesn’t change the next flip. After five heads, the chance of heads is still 50%. Thinking tails is “due” is the gambler’s fallacy. The coin has no memory, and each flip starts fresh. Over time the overall share evens out, but streaks aren’t cancelled out.
How do I calculate coin flip streak probability?
For one named streak, use (1/2)^n, where n is the streak length. For a streak somewhere in many flips, track the current run length after each flip. Add up the chance of hitting your target length. A coin flip streak calculator does this for you in seconds. Our chart shows the answers for 20, 50 and 100 flips.
Can a streak prove a coin is biased?
Not by itself. Ten heads in a row has a 1 in 1,024 chance with a fair coin. Yet in 100 flips, a run of ten of the same side shows up about 9% of the time. To spot a biased coin, you need many flips and a count of the overall share of heads.

Related Articles

Coin Flip GIF: 5 Free Ways to Get Animations, Sounds and Images
The safest way to get a coin flip gif is to use a free online flipper or a CC0 / public-domain animation, then save it as…

Flip a Coin 100 Times: Ultimate 2026 Guide + Free Simulator
Flip a coin 100 times and you’ll usually see about 50 heads and 50 tails, but anything from roughly 40 to 60 heads is normal. You…

Heads and Tails Coin Flip: The Ultimate 2026 Guide
A heads and tails coin flip is the quickest fair way to settle a decision between two options. You toss a coin, one side lands up,…
Need a Quick Decision?
Flip a coin and let chance decide — instantly, honestly, and for free.
Flip a Coin