
10 Tails in a Row Probability (Odds, Formula, Chart)
 10 min read
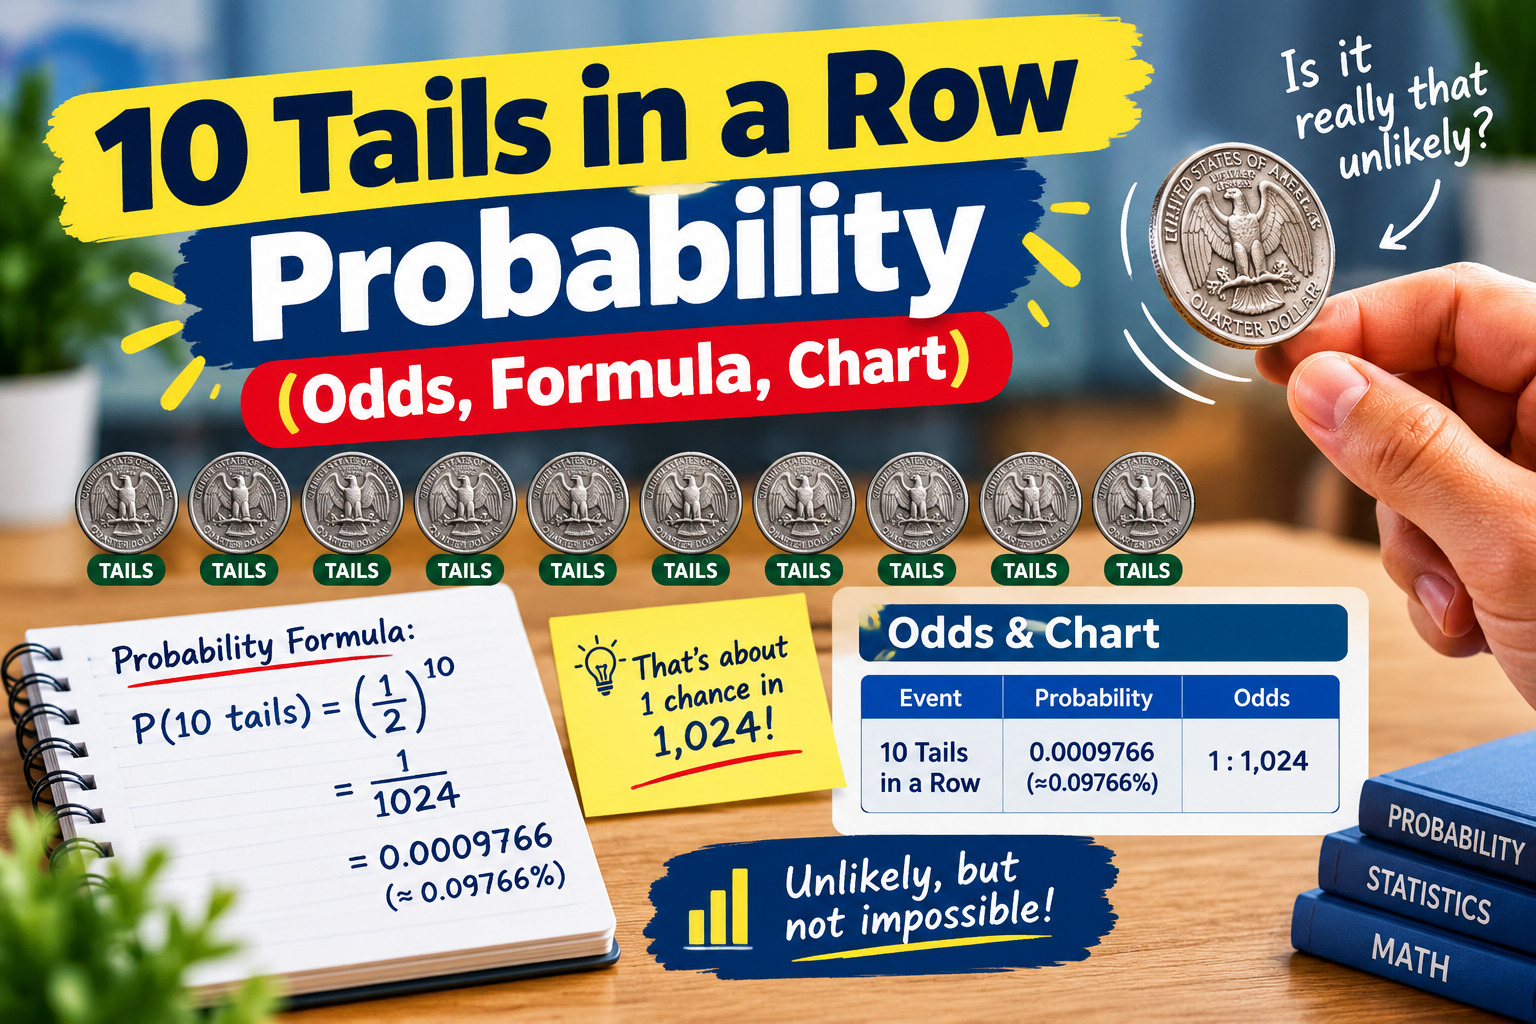
10 Tails in a Row Probability (Odds, Formula, Chart)..Picture a friend holding a coin. He’s flipped tails nine times in a row, and now he’s saying, “Ten’s coming, I can feel it.” Or worse, “It has to be heads now.”
Both feelings are normal, and both are a little off. Below, I’ll show you exactly how likely a ten-tails streak is, how to work it out yourself, and why your gut tends to get it wrong. Everything is explained in plain English, and you can test it on our free online coin flip..
10 Tails in a Row Probability Formula
The formula is P = (1/2)^10. A fair coin has two equally likely sides, so the chance of tails on one flip is 1/2.
Each flip is what statisticians call a Bernoulli trial: one try with exactly two outcomes, like heads or tails. Because the flips are independent events, we can multiply their probabilities.
Here’s the general version for any streak:
P(streak) = p^n
- p is the probability of tails on one flip (0.5 for a fair coin)
- n is the number of tails you want in a row (10 here)
Plug in the numbers and you get 0.5 × 0.5 × 0.5 … ten times, which equals 0.0009765625. Same answer, different clothes.
How to Calculate 10 Tails in a Row Probability Step by Step
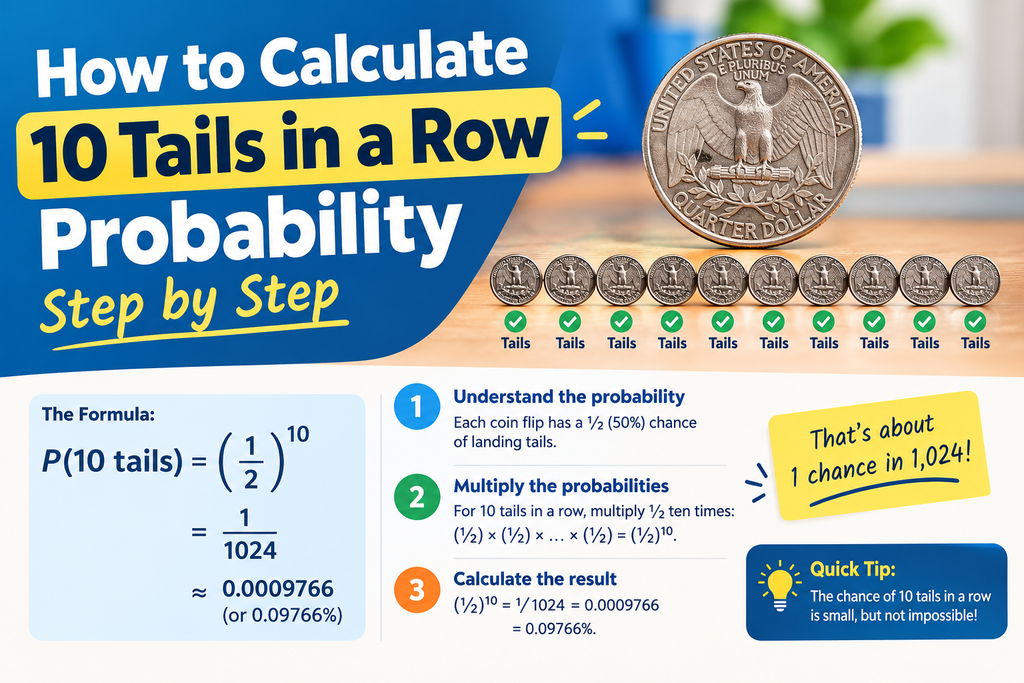
You don’t need a fancy calculator. A phone will do. Here’s the 10 tails in a row probability step by step:
- Pick the event. You want tails on flip 1, flip 2, and so on through flip 10.
- Find the single-flip probability. For a fair coin, P(tails) = 1/2 = 0.5.
- Check independence. One flip doesn’t affect the next, so multiplying is allowed.
- Multiply ten times. (1/2)^10 = 1/1024.
- Convert to a decimal. 1 ÷ 1024 = 0.0009765625.
- Convert to a percentage. 0.0009765625 × 100 = 0.09765625%, which rounds to about 0.098%.
If you want to calculate 10 tails in a row probability for a different streak, just change the exponent. Five tails is (1/2)^5, and twenty tails is (1/2)^20.
10 Tails in a Row Probability Percentage and Odds
Here’s the same answer written four ways, so you can use whichever one you need:
- Fraction: 1/1024
- Decimal: 0.0009765625
- Percentage: about 0.098%
- Odds: roughly 1 in 1,024 attempts
So the chance of flipping 10 tails in a row is tiny but not impossible. If 1,024 people each flipped a coin ten times, you’d expect about one of them to get all tails. That “expect” is the expected value talking, and it’s an average, not a promise.
What if you’d be happy with ten of either side? The chance of 10 heads or 10 tails in 10 flips is 2/1024, which is 1/512, or about 0.195%. You get two chances to be lucky, so the odds double.
10 Tails in a Row Probability Table
The numbers look boring at first. Then you notice how fast they shrink. Here’s a 10 tails in a row probability table for streaks of different lengths, using a fair coin:
| Tails in a row | Probability | Odds |
| 1 | 50% | 1 in 2 |
| 2 | 25% | 1 in 4 |
| 3 | 12.5% | 1 in 8 |
| 4 | 6.25% | 1 in 16 |
| 5 | 3.125% | 1 in 32 |
| 6 | 1.5625% | 1 in 64 |
| 7 | 0.78125% | 1 in 128 |
| 8 | 0.390625% | 1 in 256 |
| 9 | 0.1953125% | 1 in 512 |
| 10 | 0.09765625% | 1 in 1,024 |
| 15 | about 0.003% | 1 in 32,768 |
| 20 | about 0.0001% | 1 in 1,048,576 |
Each row is exactly half the row above it. That’s the whole pattern in one line.
10 Tails in a Row Probability Chart
If you plot those numbers as a bar chart, you’ll see a steep drop. The first bar (one tail) is tall at 50%. By the fourth or fifth bar, the bars are already tiny, and by ten tails the bar is nearly flat against the bottom.
Mathematicians call this exponential decay. The probability halves with every extra flip, so the line curves down fast and then crawls along the floor.
If you build this chart for your own page, put the streak length (1 to 10) on the horizontal axis and probability (%) on the vertical axis. A bar chart works best for a beginner audience.
Suggested alt text for the chart image: “Bar chart showing the probability of flipping tails in a row, halving with each extra flip from 50% at one flip to 0.098% at ten flips.”
10 Tails in a Row Probability Calculator
You can build a simple 10 tails in a row probability calculator in a spreadsheet in under a minute. It only needs three inputs:
- Probability of tails (p): 0.5 for a fair coin
- Streak length (k): 10
- Number of flips (n): how many times you plan to flip
For one exact streak of ten flips, type this into a cell:
=0.5^10
For the chance of getting a ten-tails run somewhere in n flips, use this approximation (replace p, k and n with your cells or numbers):
=1-EXP(-(p^k*(1+(n-k)*(1-p))))
Set p to 0.5, k to 10 and n to 100, and it returns about 4.4%. If you just want to see streaks happen in real time, the coin flip tool on this site lets you flip as many times as you like, no math needed.
Chance of Flipping 10 Tails in a Row in 100 or 1,000 Flips
Ten tails in exactly ten flips is rare. But what if you keep flipping? Then a streak can start at any point, and your chances climb.
- In 100 flips: about 4.4%
- In 1,000 flips: about 38%
These are approximations, not exact values. Here’s the quick reasoning. A streak can begin on flip 1 (probability 1/1024) or on any later flip that follows a heads, which has probability 1/2048 for each starting spot. Add those up and you get the expected number of streaks. For 100 flips that’s about 0.045. For 1,000 flips it’s about 0.48. Then 1 − e^(−0.48) gives roughly 38%.
So a ten-tails run in 1,000 flips isn’t a miracle. It’s closer to “happens more than a third of the time.” This is the law of large numbers and a bit of its sneaky cousin at work: give randomness enough room and strange-looking patterns appear all by themselves.
Why 10 Tails in a Row Feels More Likely Than It Is
Our brains are pattern machines, and coins are great at tricking them. Two ideas explain most of it.
The gambler’s fallacy is the belief that past flips change the next one. After nine tails, people think heads is “due.” It isn’t. The coin has no memory. The next flip is still 50/50, whether you’ve just seen nine tails or nine heads.
The clustering illusion is our habit of seeing meaning in random clumps. Real random sequences have streaks in them. In fact, if someone shows you a “random” list of flips with no runs longer than three, that list is more suspicious than one with a run of seven.
Here’s a handy way to hold both ideas. The odds of getting to ten tails are 1 in 1,024. But once you’ve already flipped nine tails, the odds of the tenth being tails are just 1 in 2. Both statements are true. They answer different questions.
One more honest note: real coins aren’t perfect. A 2007 paper by Diaconis, Holmes and Montgomery, “Dynamical Bias in the Coin Toss,” found that a coin lands on the same side it started on about 51% of the time. That’s a tiny edge, and it doesn’t make ten tails likely. It just means a physical coin isn’t quite the ideal 50/50 of a textbook.
Odds of 10 Tails in a Row vs Other Events
How rare is 1 in 1,024? Compare it with other coin streaks, where the math is easy to verify:
- Five tails in a row is 1 in 32. You’ll see that one fairly often if you flip for a while.
- Ten tails in a row is 1 in 1,024, which is 32 times rarer than five.
- Fifteen tails in a row is 1 in 32,768, which is 32 times rarer than ten.
- Twenty tails in a row is 1 in 1,048,576, which is 1,024 times rarer than ten.
See the pattern? Every five extra flips makes the streak 32 times less likely. Every ten extra flips, 1,024 times less likely.
Try It Yourself with an Online Coin Flip

Reading about streaks is fine, but flipping makes it stick. Here’s a quick experiment you can run in about ten minutes:
- Open the online coin flip.
- Flip 100 times and write down each result (a tally sheet or spreadsheet works).
- Circle the longest run of tails.
- Repeat a few times and compare your longest streaks.
Most people are surprised that runs of four, five or even six tails show up in a single 100-flip session. That matches the math: a run of 6 or more happens in a 100-flip session quite often.
My own test: I flipped a coin 1,000 times using the tool, and the longest tails streak was [INSERT REAL RESULT]. (Author: run this yourself and fill in the real number before publishing. Please don’t publish a guess.)
The Takeaway
Ten tails in a row is a 1-in-1,024 event, about 0.098%. It’s rare in a single set of ten flips, but over hundreds or thousands of flips, streaks like that do show up. And no matter how long a streak runs, the next flip stays 50/50. Want to see it for yourself? Head to the coin flip tool and start flipping.
Methodology note (add at the bottom of the article): All probabilities assume a fair coin with independent flips. Exact values come from (1/2)^n. The 100-flip and 1,000-flip figures are approximations using the expected number of run starting positions, then 1 − e^(−expected value). Anyone can check them with a calculator or spreadsheet.
What is the probability of flipping 10 tails in a row?
With a fair coin, it’s 1 in 1,024, or about 0.098%. You find it by calculating (1/2)^10. Each flip has a 50% chance of tails, and because flips are independent, you multiply those chances together ten times.
What are the odds of 10 tails in a row in a coin flip?
The odds are about 1 in 1,024 for ten flips. That means if you tried ten-flip sets over and over, you’d expect roughly one all-tails set per 1,024 attempts on average. It’s an average over many tries, not a guarantee.
Is flipping 10 heads or 10 tails more likely than just 10 tails?
Yes, exactly twice as likely. The chance of 10 heads or 10 tails in 10 flips is 2/1024, or 1/512, about 0.195%. Either side counts, so the probabilities add together.
If I get 9 tails in a row, is the next flip more likely to be heads?
No. The next flip is still 50/50. A coin has no memory, and past results don’t change future flips. Believing otherwise is called the gambler’s fallacy, and it’s one of the most common probability mistakes.
What is the chance of 10 tails in a row in 1,000 flips?
It’s about 38%. That’s an approximation based on the expected number of streaks. Over 1,000 flips there are many possible starting points for a run, so a ten-tails streak is far more likely than in a single set of ten flips.
How do you calculate the probability of 10 tails in a row?
Multiply the probability of tails, 1/2, by itself ten times: (1/2)^10 = 1/1024 ≈ 0.098%. The general formula is p^n, where p is the chance of tails on one flip and n is the streak length you want.
Can a real coin be biased?
Slightly. A 2007 study by Diaconis, Holmes and Montgomery found coins land on their starting side about 51% of the time. That’s a very small bias and doesn’t make long streaks likely. For everyday math, treating a coin as 50/50 is a safe choice.

Related Articles

Coin Flip GIF: 5 Free Ways to Get Animations, Sounds and Images
The safest way to get a coin flip gif is to use a free online flipper or a CC0 / public-domain animation, then save it as…

Flip a Coin 100 Times: Ultimate 2026 Guide + Free Simulator
Flip a coin 100 times and you’ll usually see about 50 heads and 50 tails, but anything from roughly 40 to 60 heads is normal. You…

Heads and Tails Coin Flip: The Ultimate 2026 Guide
A heads and tails coin flip is the quickest fair way to settle a decision between two options. You toss a coin, one side lands up,…
Need a Quick Decision?
Flip a coin and let chance decide — instantly, honestly, and for free.
Flip a Coin